Reporting
The Teleportel system generates two tables ('Download .csv' and 'Log Data') with raw .csv data available to be imported into your own Excel, where you can create your own stats, graphs, etc.
There are 3 steps in the process :
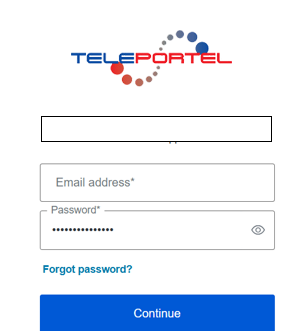
1.Login with your Report Login credentials
2. Following data becomes available
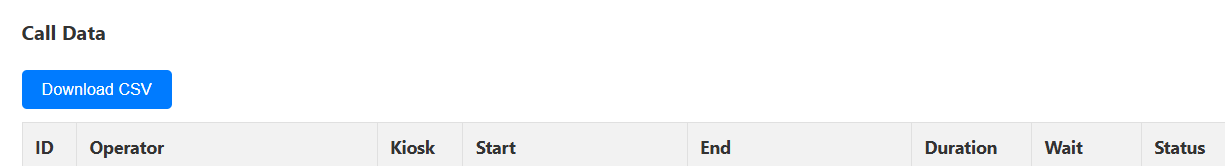
ID is the unique identification number of the record
Operator is the 'Agent'
Kiosk is the 'Reception Kiosk'
Start is the timestamp of the beginning of the video connection
End is the timestamp of the end of the video connection
Duration shows how long the call was connected
Wait is the time lapsed between the Guest pushing the touchscreen and the Agent establishing the connection
Status : should say 'done' (call completed)
If required for your specific needs, additional data can be added (such as for instance 'Visitor Satisfaction Rating', featuring a numeric number like 1-10 or Smileys)
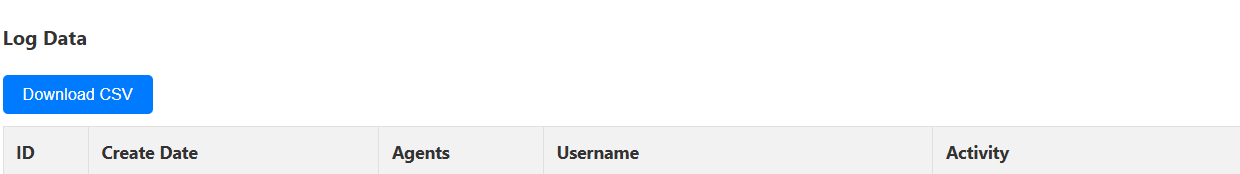
ID is the unique identification number of the record
Create Data : the activity of the agent
Agents : name of the agent
Username : login account of the agent
Activity : what was the action of the agent, such as logout, login, reload page, etc..
3. Click the button to download
Click 
The data appears as follows :
ID,CreateDate,Agents,Username,Activity
543,"2025-05-19 14:57:45",backoffice,report@teleportel.com,login_or_reloadedpage
542,"2025-05-19 12:57:35",backoffice,lucdebacker@teleportel.com,logout
541,"2025-05-19 14:57:30",backoffice,lucdebacker@teleportel.com,login_or_reloadedpage
and import this data into your spreadsheet